
 Arabic
 Chinese
 Dutch
 English
 French
 German
 Indonesian
 Italian
 Japanese
 Korean
 Malay
 Portuguese
 Russian
 Spanish
PHP Luminova: Debugging and Troubleshooting Application
Debug Luminova applications with built-in tools for breakpoints, tracing, and data inspection to quickly identify issues and monitor execution flow.
Luminova provides a suite of tools and utilities to help developers debug applications efficiently. From lightweight breakpoints to tracing execution and inspecting data at multiple checkpoints, profiling, logging and error display. These tools make it easier to identify issues, monitor application flow, and ensure code behaves as expected in both development and production environments.
Track Breakpoint
The Luminova Tracer breakpoint is a lightweight utility that allows you to register breakpoints in your code and manually inspect the process during execution.
Register Breakpoint
You can register multiple debug checkpoints:
use Luminova\Debugger\Tracer;

function example(): array
{
    $users = Users::select();
    Tracer::breakpoint(1, $users, 'List users');

    $parsed = process($users);
    Tracer::breakpoint(2, $parsed, 'After processing users');

    $data = inspect($parsed);
    Tracer::breakpoint(3, $data, 'Inspect processed data', function (array $debug, array $points): void {
        // e.g., rollback a transaction or log state
    });

    return $data;
}
Inspect Breakpoint
Execute a function and trace a specific breakpoint:
use Luminova\Debugger\Tracer;

// Trigger break when reaching breakpoint 2
Tracer::trace(2);

// Call the example function
example();

// Retrieve all registered breakpoints
print_r(Tracer::getBreakpoints());Note:If you do not call
Tracer::trace(...)before executing the function, the registered breakpoints will be skipped.
Performance Profiling
Luminova comes with a built-in performance profiler to help you see how your application behaves as it runs. You don't need to install anything or wire up extra packages. Just enable it in your environment file:
debug.show.performance.profiling = trueOnce it's on, Luminova will start tracking key performance data for every request.
How Profiling Works
In the browser:A small floating panel appears at the bottom of each page. It shows real-time metrics such as:
- Number of files loaded
- How many belong to Luminova's core
- How many come from third-party libraries
- Execution time
- Memory usage
Click the panel to expand it and see deeper details. It's meant to show you what's slowing things down and where the load is coming from.
In CLI mode:After a command finishes, the profiler prints the same metrics directly to the terminal.
For API responses:Profiling data is logged as JSON using the metrics log level.This keeps API output clean while still giving you complete performance data in your logs.
Why It Matters
Good performance starts with knowing what actually happens inside your application. The profiler gives you visibility into:
- Slow sections of your code
- Heavy modules
- Memory growth
- Expensive third-party libraries
- Unexpected file loads
Catching these early will save you headaches later, especially when your application grows.
Web Profiling Example

CLI Profiling Example

Note:Keep the profiler on during development. When something feels slow, don't guess—check the panel. It's faster, clearer, and a lot more honest than relying on “it feels fine to me.”
Maintenance Mode
Maintenance mode is a simple way to take your app offline while you debug, update, or fix something without exposing errors to visitors. Instead of showing the real page, Luminova serves a clean maintenance screen.
To enable it, set this in your environment file:
app.maintenance.mode = trueOnce this is on, every visitor is shown the maintenance page until you turn it off again.
Auto-Refresh While Waiting
If you want the browser to automatically check when your app is back online, set:
app.maintenance.retry = <seconds>For example, app.maintenance.retry = 10 makes the page refresh every 10 seconds.This keeps users from constantly guessing when your site is working again.
Custom Maintenance Page
You can edit the default template here:
/app/Errors/Defaults/maintenance.phpYou're free to redesign it, add branding, or keep it simple.
Important Note:
Keep the page light. Don't depend on modules, helpers, or features that may not load during maintenance. If they fail, the user will see an error instead of your maintenance message. Stick to plain PHP, HTML, and whatever basic styles you need.
Error Display
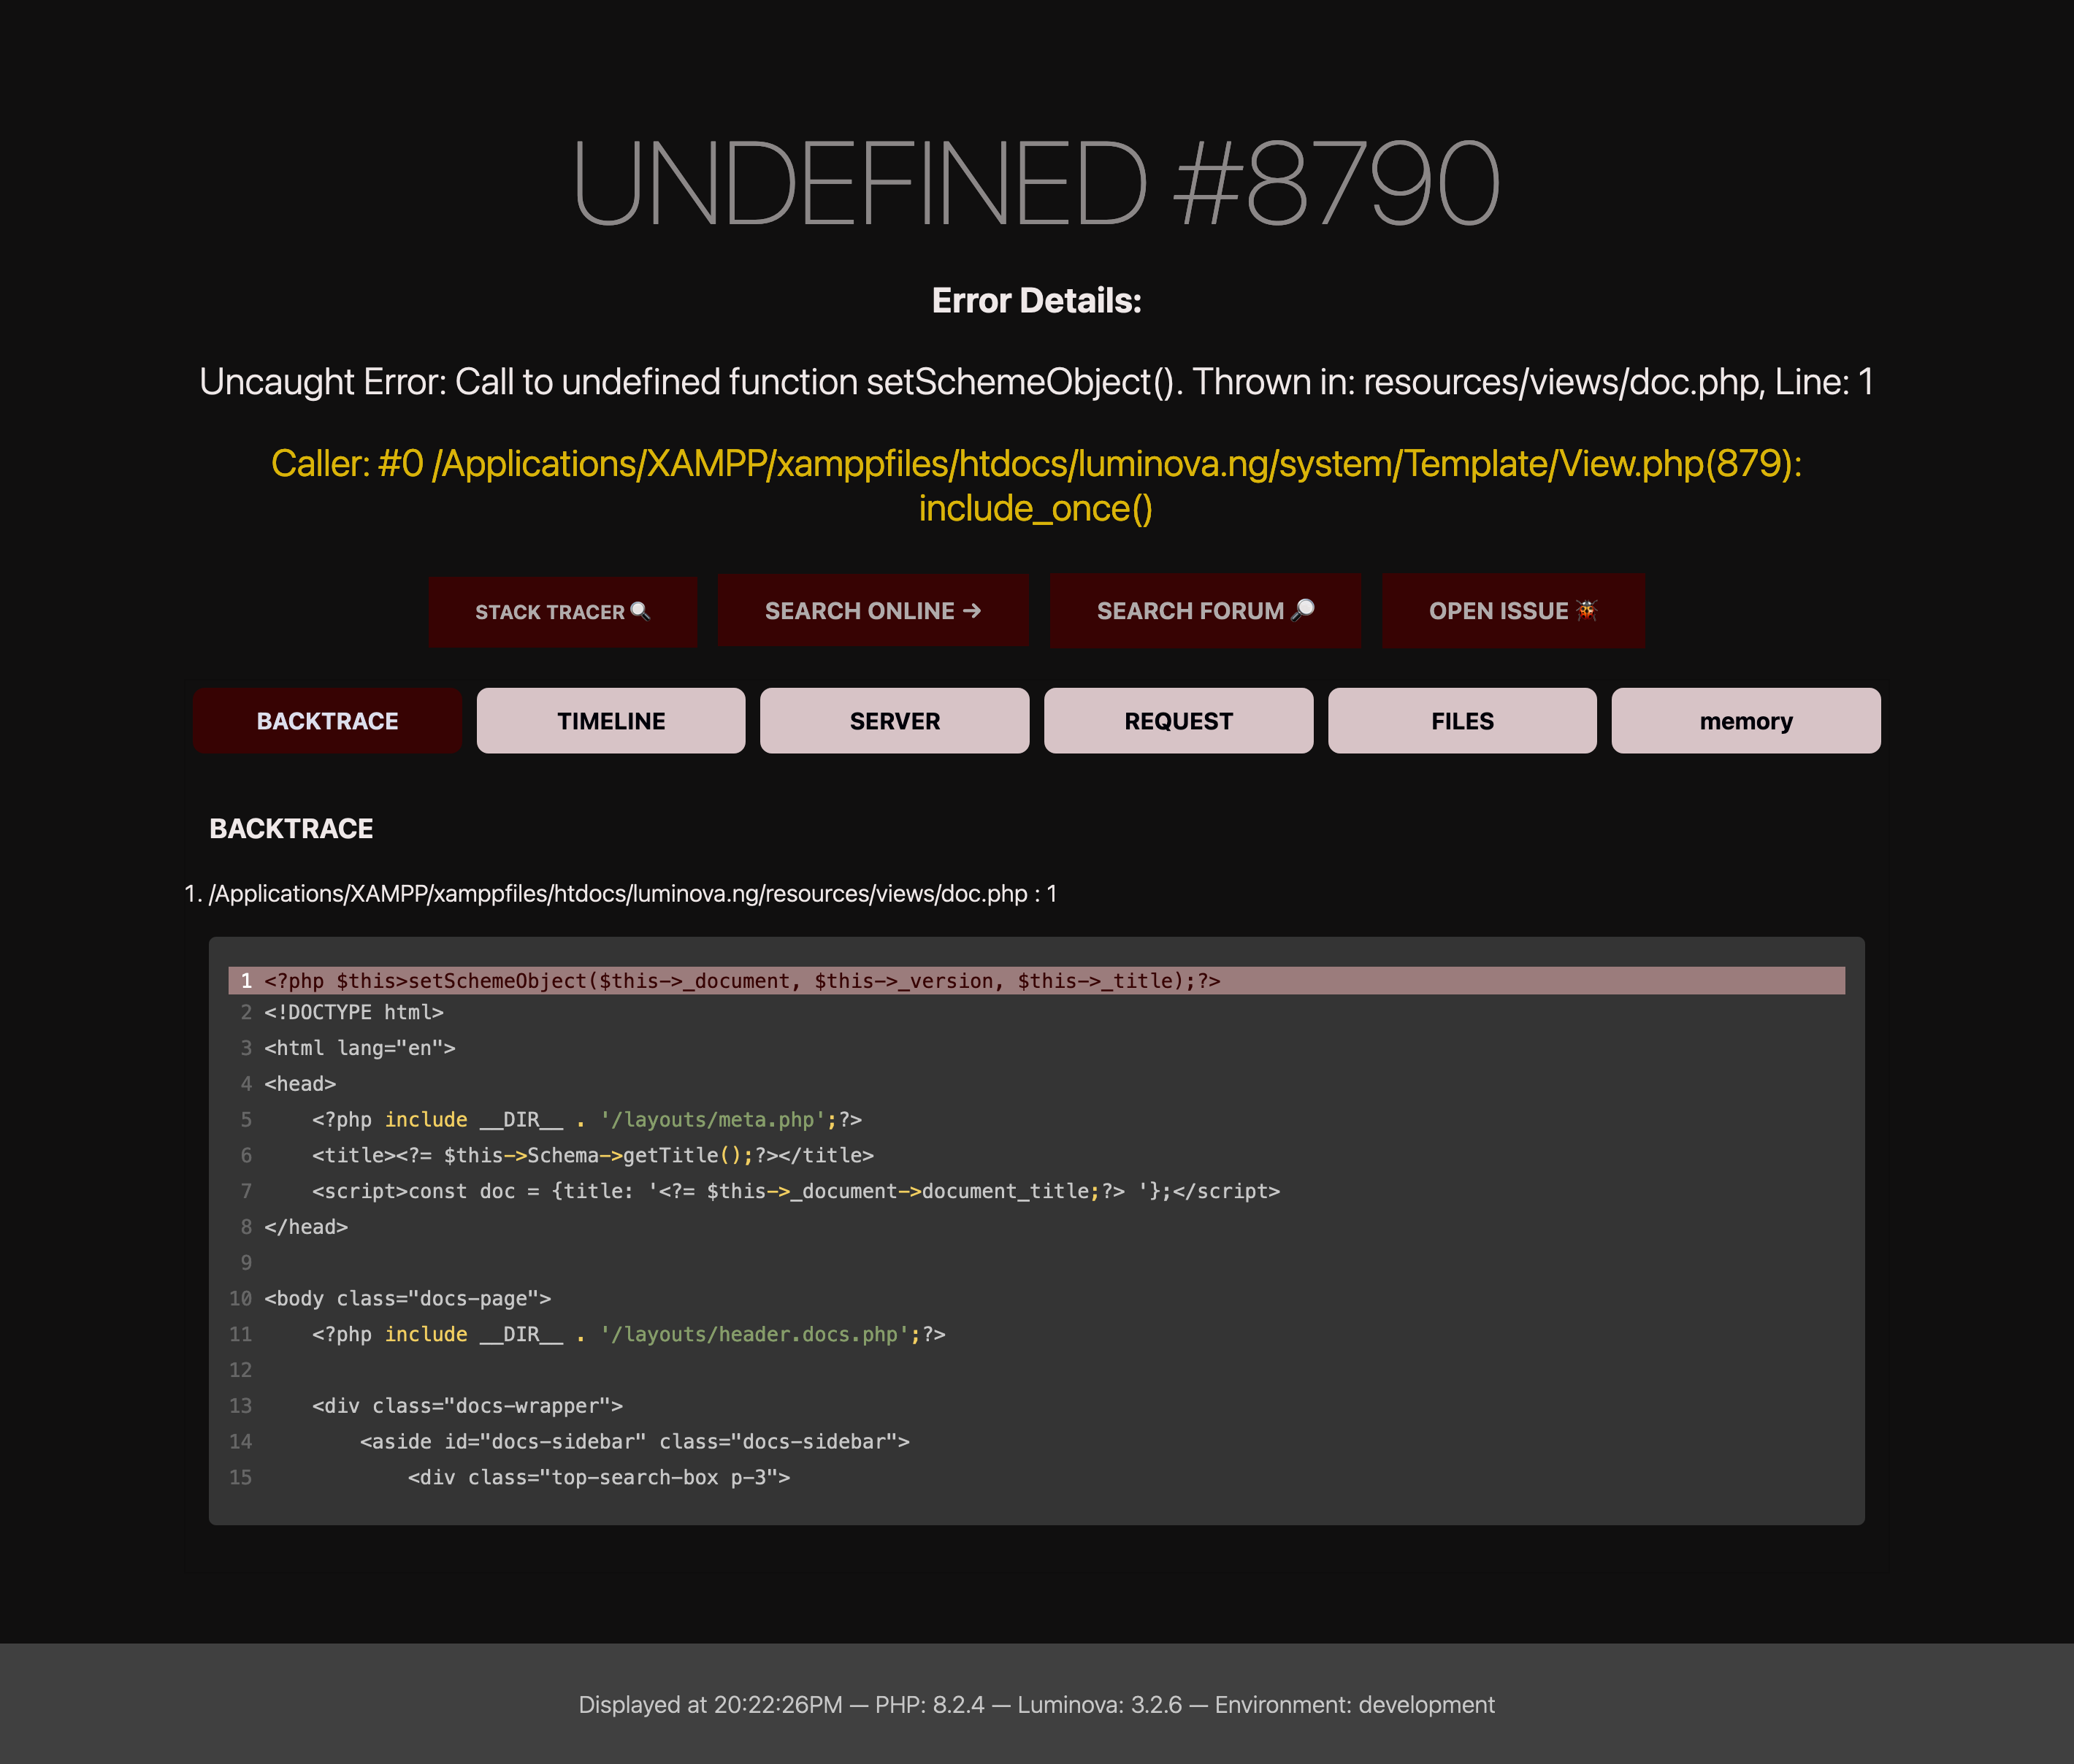
Luminova includes a strong error-handling system that catches fatal errors and shows a structured error page. This page gives you a clear breakdown of what failed, where it happened, and how the error reached that point. It's far easier to work with than a blank 500 screen or a raw PHP dump.
Custom Error Page
In Production
Visitors see a clean, professional message instead of raw error output. This keeps your app looking stable even during a crash, and prevents sensitive information from leaking to the public.
In Development
The same error page expands to show deeper diagnostic information such as stack traces, file paths, and call history. It gives you everything you need to trace the failure back to the exact line.
Debug Tracing
If you want even more detail, enable:
debug.show.tracer = trueThis adds a full trace view that highlights the specific file, line, and part of the code responsible for the failure. When you're tracking down a stubborn bug, this extra visibility saves time.
Disabling the Custom Error Page
If you'd rather see raw PHP errors directly in the browser, you can turn off the custom error page:
debug.display.errors = trueThis forces PHP to print errors straight to the output. It's simple and useful for quick local debugging, but it should never be on in production.
Note:Direct error display can expose sensitive data—paths, code, variables, even credentials in some cases. Always keep the custom error page active on live systems.
Framework Fails Silently?
In some cases, Luminova may return a 500 Internal Server Error without showing any message or writing to the log. This typically means the framework failed to load during its initial setup, which prevents it from handling or reporting the error.
Common Causes
- Missing or corrupted Composer dependencies
- Incorrect file or folder permissions
When this happens, the core initialization fails, and Luminova cannot register its error handling logic, making the issue invisible nor log issues.
How to Debug It
To identify the problem, temporarily enable PHP error display in your /public/index.php file:
// /public/index.php

<?php
declare(strict_types=1);

// Temporarily add the lines below for debugging
error_reporting(E_ALL);
ini_set('display_errors', '1');

use Luminova\Boot;
use Luminova\Routing\Prefix;

require_once __DIR__ . '/../system/Boot.php';
// ...
⚠️ Important:
Remove or disable these lines once the issue is resolved to avoid exposing errors in production.
Log Debugging
Luminova automatically stores application logs in the writeable/logs/ directory. These logs are categorized by severity level, such as:
info.log- General information messagesdebug.log- Debug-level messageserror.log- Application errorscritical.log- Critical failures and exceptions
You can view these logs manually or use the command line to inspect them quickly.
Navigate to Project Root
On Production Server (Linux)
cd /var/www/example.comOn Development Server
Linux / macOS (XAMPP)
cd /Applications/XAMPP/xamppfiles/htdocs/example.comWindows (XAMPP)
cd C:\xampp\htdocs\example.comWindows (WAMP)
cd C:\wamp64\www\example.comGeneric Windows (Custom Folder)
cd D:\projects\example.comReplace
example.comwith your actual project folder name. Use the path that matches your setup. If unsure, check where your local server hosts your project files.
View Logs from the Command Line
On Linux / macOS
To read a specific log file, you can use cat, tail, or less to view logs:
# View the entire file
cat writeable/logs/info.log

# View the last 20 lines
tail -n 20 writeable/logs/error.log

# Follow new log entries in real time
tail -f writeable/logs/debug.log

# Scrollable view
less writeable/logs/critical.log
On Windows (CMD or PowerShell)
Use type, Get-Content, or more:
:: View entire file
type writeable\logs\info.log

:: View last lines (PowerShell)
Get-Content writeable\logs\error.log -Tail 20

:: Follow logs in real-time (PowerShell)
Get-Content writeable\logs\debug.log -Wait

:: Scrollable view (CMD)
more writeable\logs\critical.log
Tip: For continuous monitoring in development or production, use
tail -f(Linux/macOS) orGet-Content -Wait(PowerShell).