PHP Luminova: Application Debugging and Troubleshooting
Debugging, troubleshooting, and profiling in the Luminova framework application.
Performance Profiling
Luminova includes a built-in performance profiling tool that helps you monitor your application's performance with ease. This feature requires no additional setup or configuration. To enable it, simply set the debug.show.performance.profiling variable to true in your environment file.
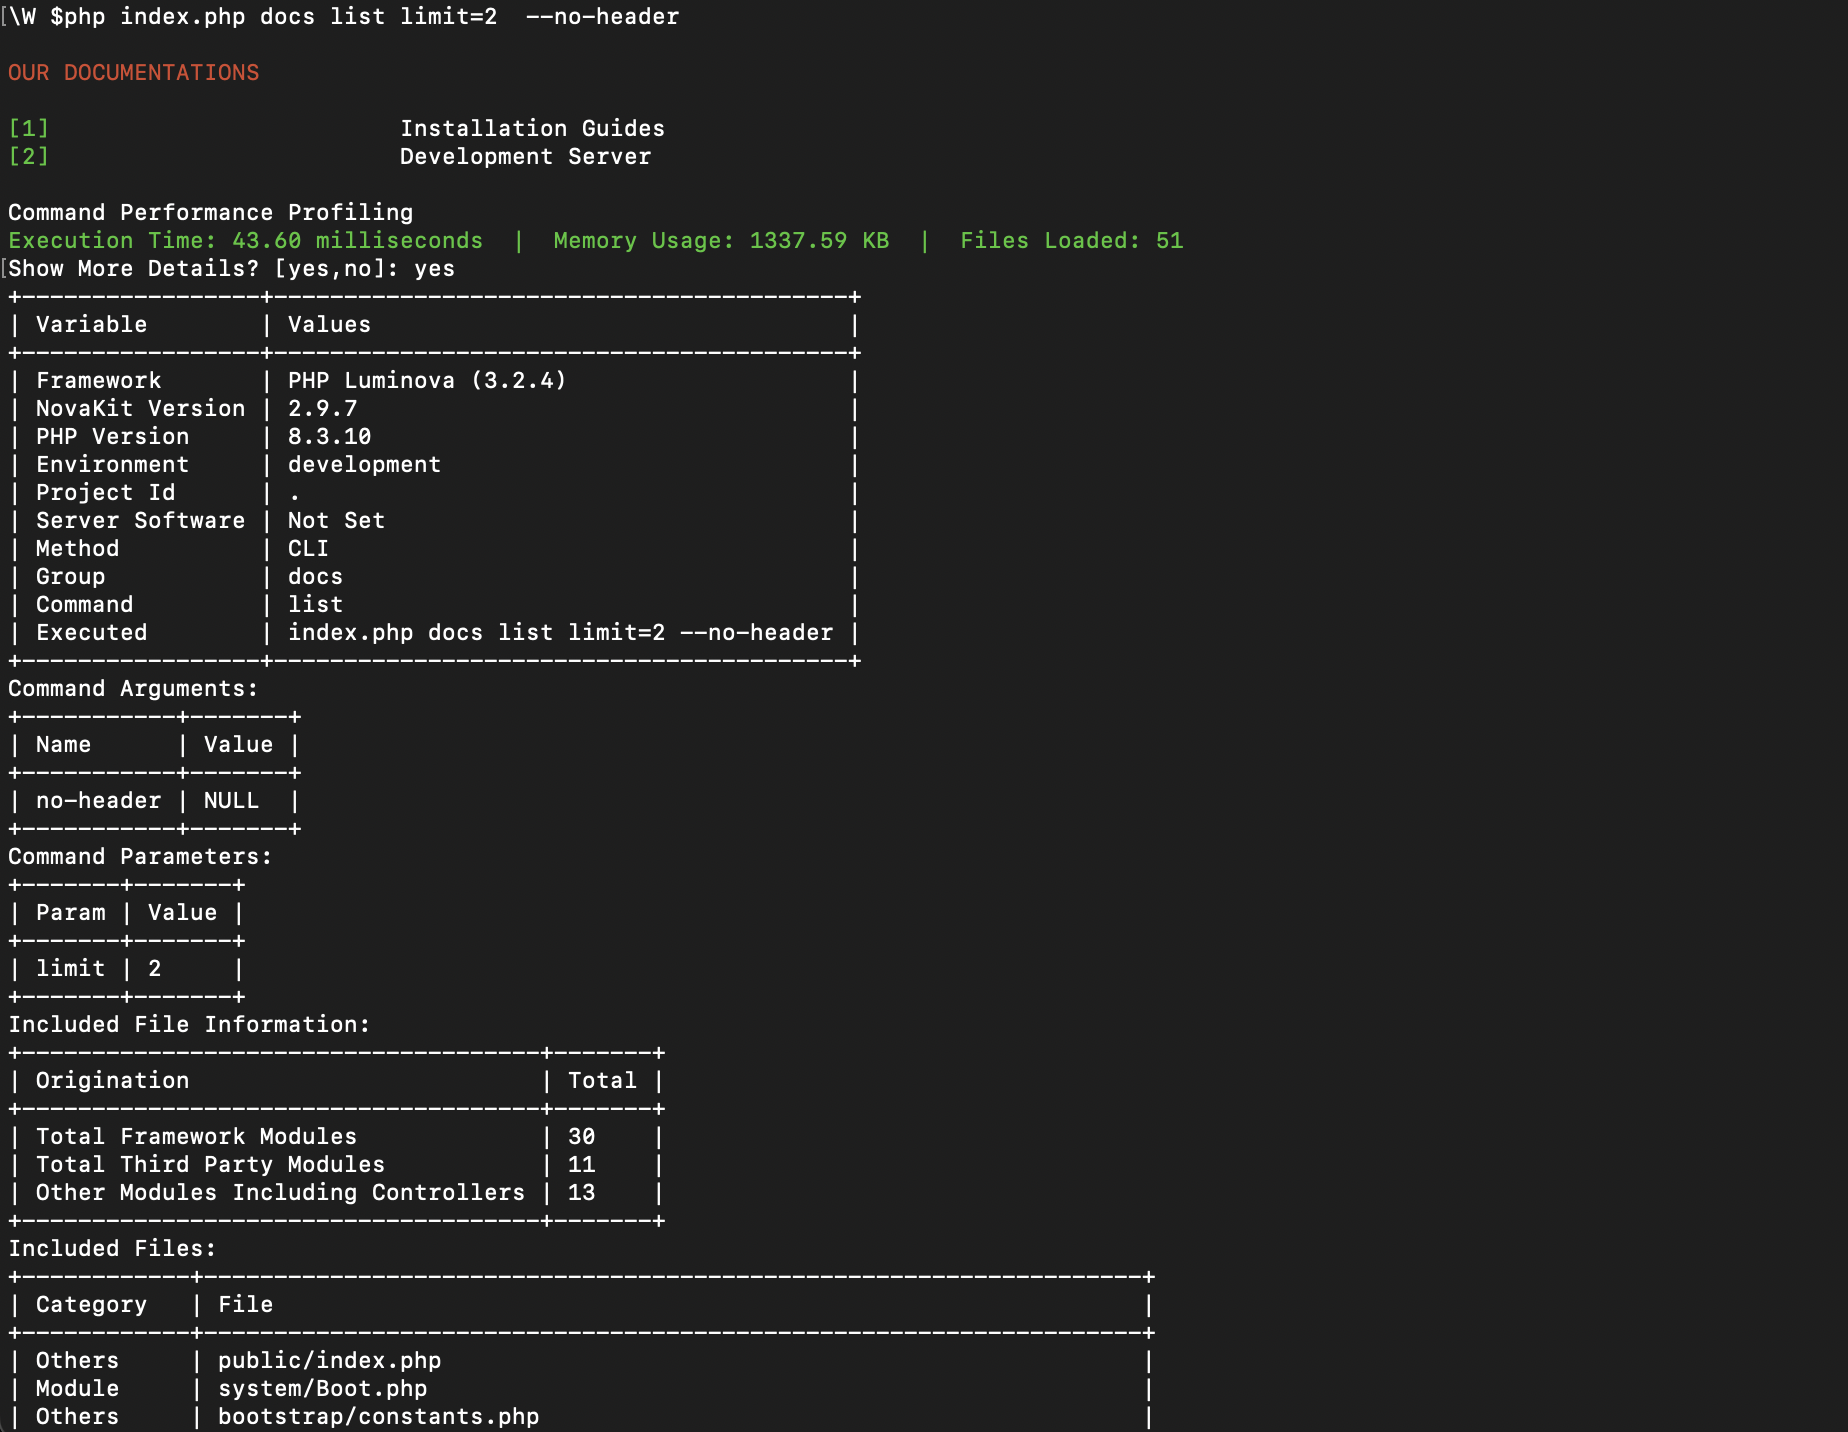
When activated, a floating profiler will appear at the bottom of each page, displaying key performance metrics. In CLI mode, the profiling information will be printed after a command has been executed, while for API, the profiling information will be logged as JSON using log level metrics .
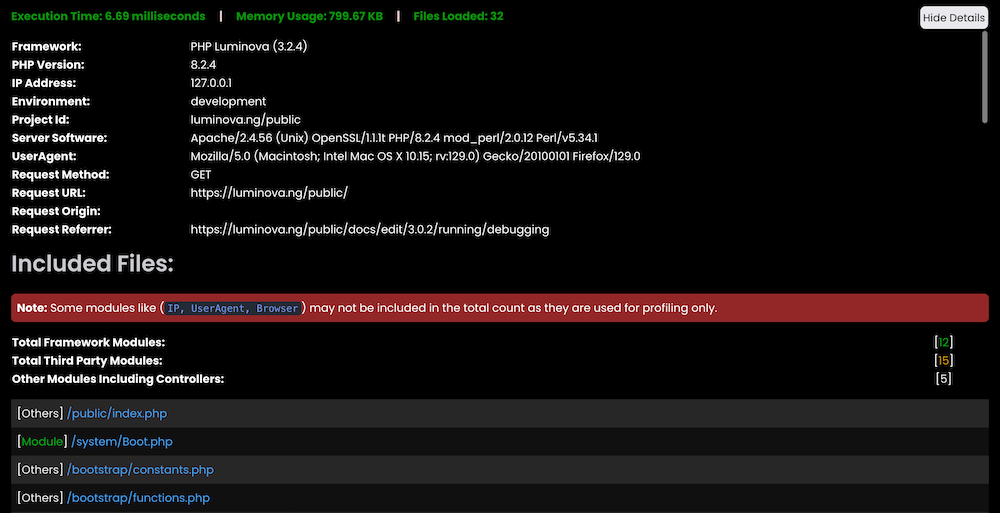
The profiler provides an overview of the current application's performance, including the total number of files included in the request. It also distinguishes between framework core modules and third-party files, giving you a clear picture of what's contributing to your application's load.
You can expand the profiling details to reveal more information, such as execution time, memory usage, and other critical metrics. This detailed insight helps you identify potential bottlenecks and optimize your application for better performance.
Web Profiling Example
CLI Profiling Example
Tip: Use the profiling tool during development to continuously monitor and improve the efficiency of your code. By addressing performance issues early, you can ensure a smoother and faster experience for your users in production.
Maintenance Mode
When performing debugging or updates on your application, particularly in a production environment, you may need to display a custom maintenance page to visitors. This informs them that the application is temporarily unavailable due to maintenance.
To activate maintenance mode, simply set the app.maintenance.mode variable to true in your environment file. Once enabled, the maintenance page will be displayed to visitors instead of the actual content.
Customizing Maintenance Mode
You can also specify how often the client's browser should refresh to check if the service has been restored by setting the app.maintenance.retry variable to the desired number of seconds. This feature is helpful for ensuring that users can automatically return to your site as soon as maintenance is completed.
For a more tailored experience, you can customize the maintenance page to match your application's design and needs. This can be done by modifying the /resources/Views/system_errors/maintenance.php file.
Important: When customizing the maintenance page, ensure that any modules or resources it depends on are available during maintenance. This prevents errors from being displayed instead of your intended message.
Error Display
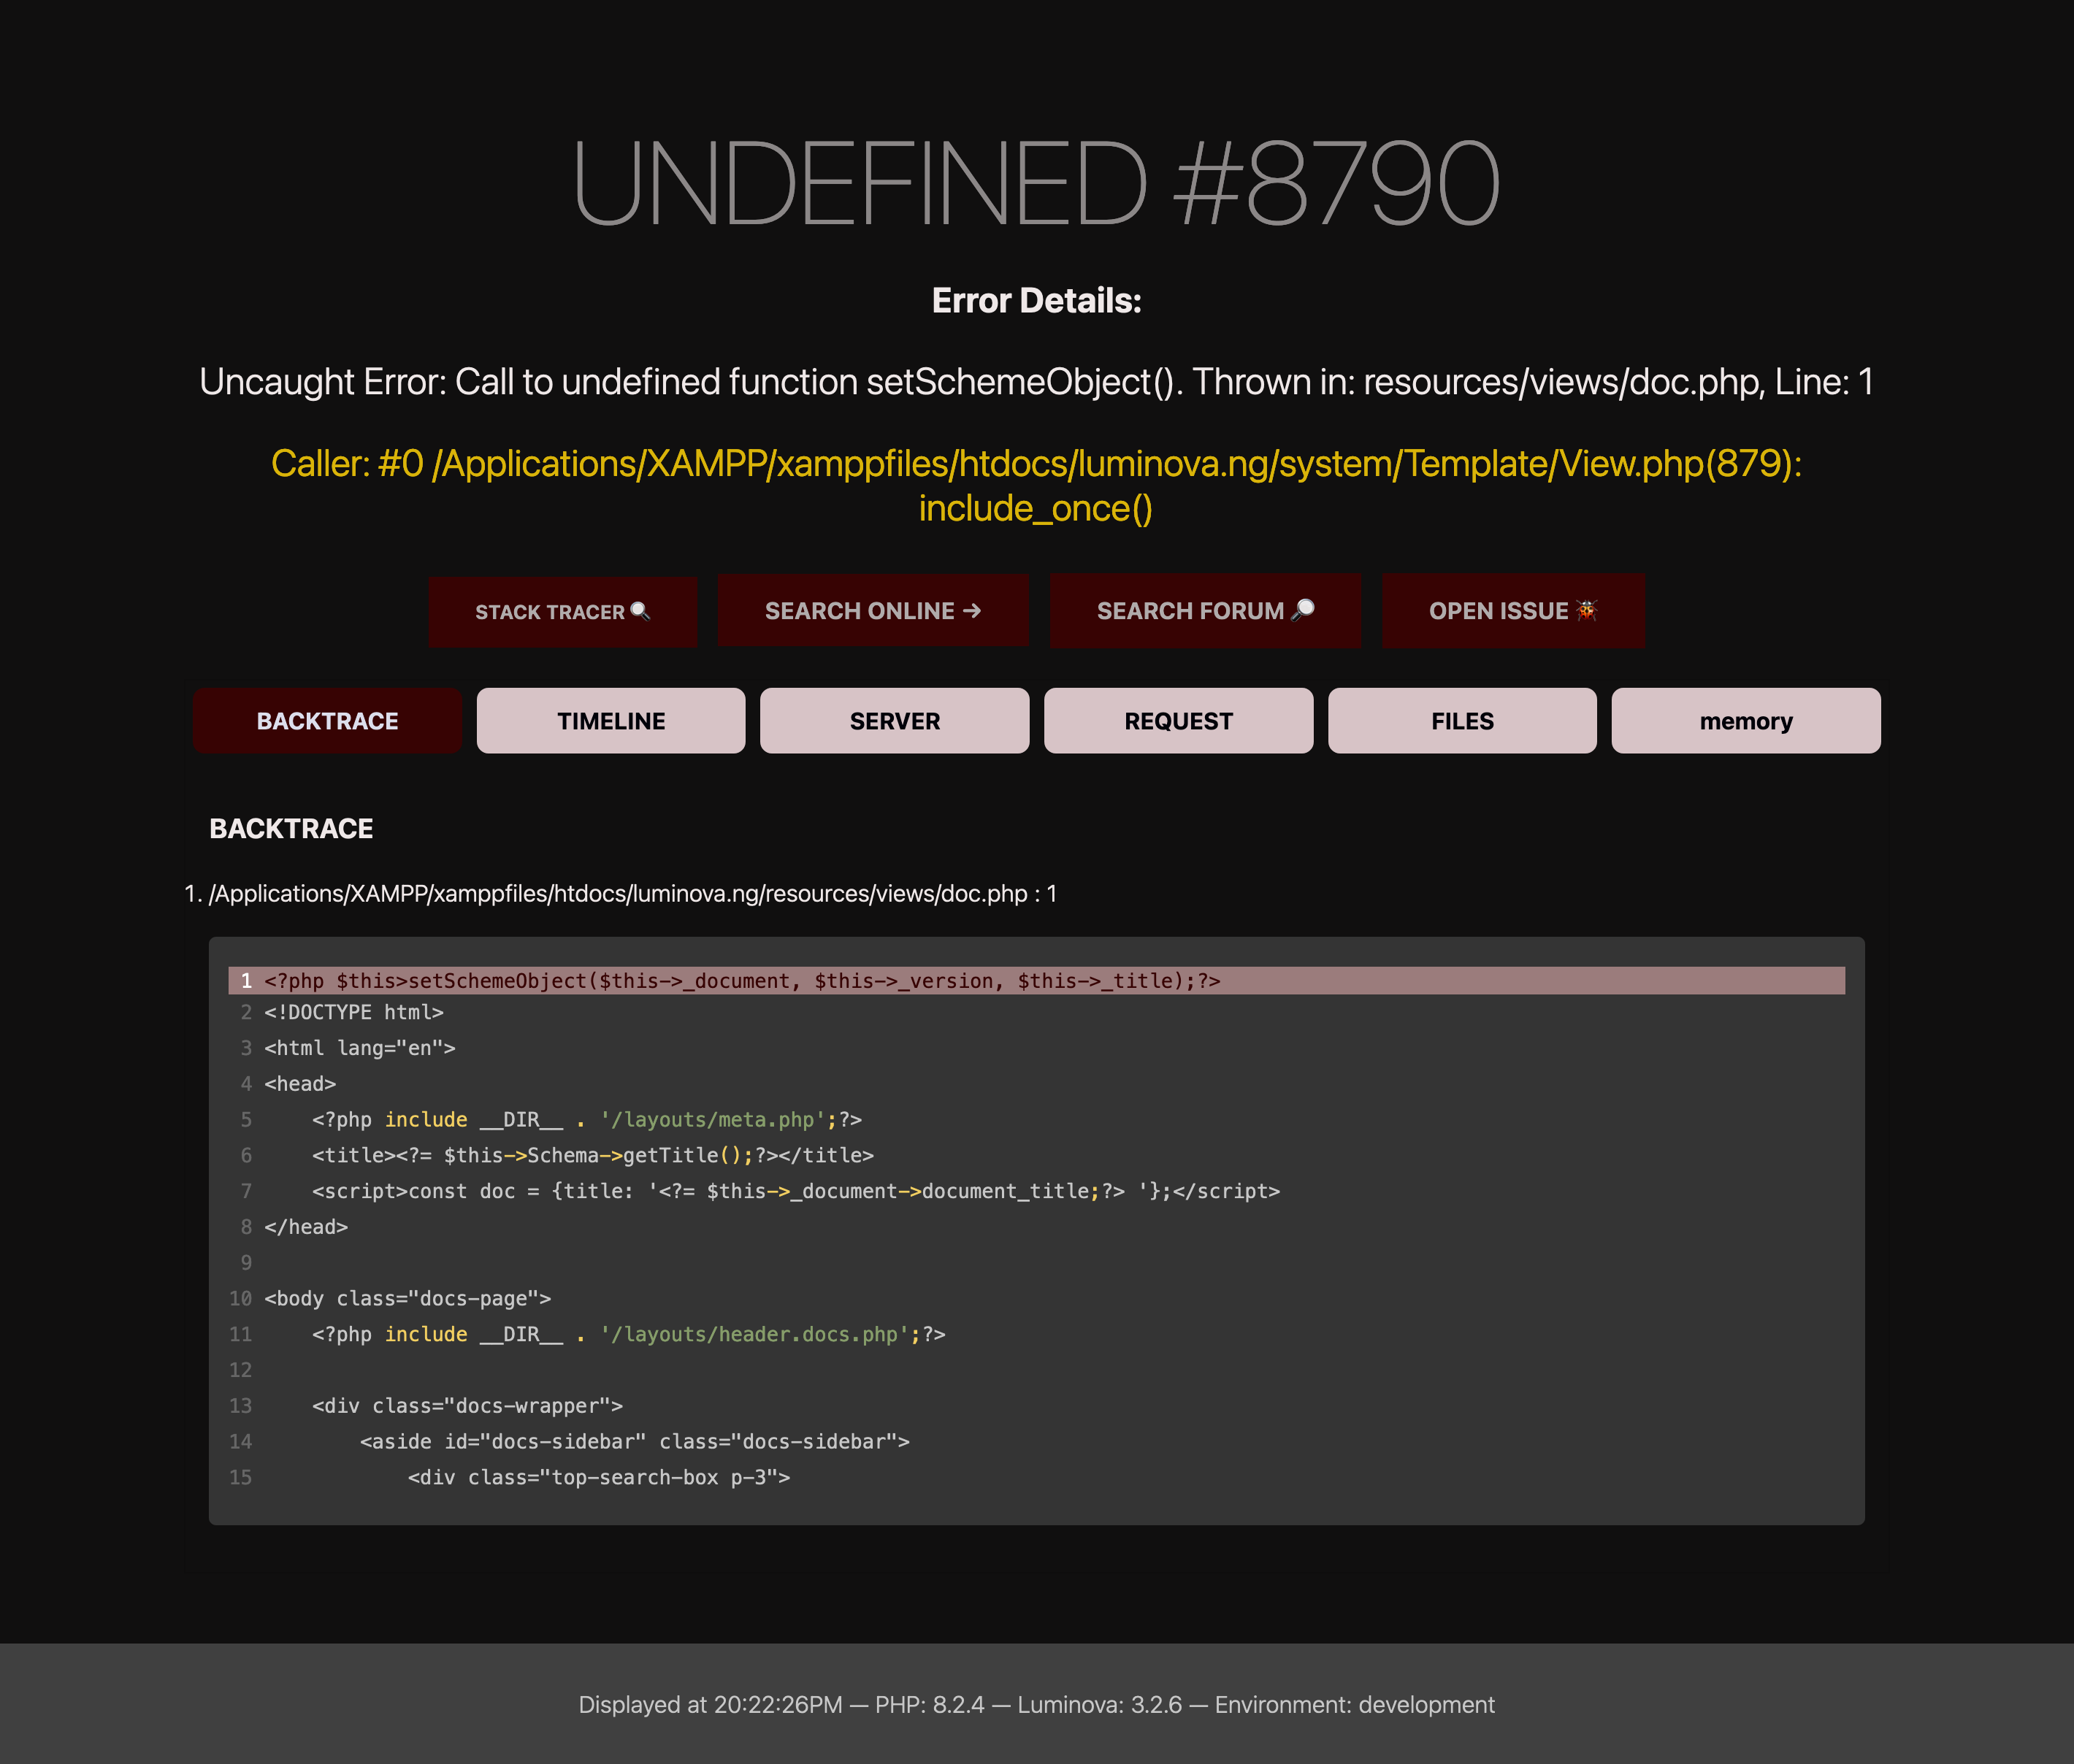
Luminova provides robust error handling that displays a custom error page if a fatal error causes the application to shut down. This approach is recommended as it offers detailed insights into the error, including stack traces, making it easier to diagnose and resolve issues.
Custom Error Page
Production: The custom error page provides a user-friendly way to inform visitors that something has gone wrong, while also helping you maintain a professional appearance even during critical issues. This feature is especially useful in production environments, where displaying raw error messages could expose sensitive information.
Development: The custom error page, provides a detailed error information, including stack traces, which can be crucial for debugging.
Disabling Custom Error Pages
If you prefer to have errors printed directly on the page, bypassing the custom error page, you can easily disable this feature. To do so, set the debug.display.errors variable to true in your environment configuration. When enabled, this setting will cause errors to be displayed directly in the browser, which may be useful during development but should be handled with caution in production.
Note: Disabling the custom error page may expose sensitive information to users. It's recommended to keep this feature enabled in production environments for security reasons.
Framework Fails Silently?
In some cases, Luminova may return a 500 Internal Server Error without showing any message or writing to the log. This typically means the framework failed to load during its initial setup, which prevents it from handling or reporting the error.
Common Causes
- Missing or corrupted Composer dependencies
- Incorrect file or folder permissions
When this happens, the core initialization fails, and Luminova cannot register its error handling logic — making the issue invisible by default.
How to Debug It
To identify the problem, temporarily enable PHP error display in your /public/index.php file:
// /public/index.php

<?php
declare(strict_types=1);

// Temporarily add the lines below for debugging
error_reporting(E_ALL);
ini_set('display_errors', '1');

use Luminova\Boot;
use Luminova\Routing\Prefix;

require_once __DIR__ . '/../system/Boot.php';
// ...
⚠️ Important: Remove or disable these lines once the issue is resolved to avoid exposing errors in production.
Log Debugging
Luminova automatically stores application logs in the writeable/logs/ directory. These logs are categorized by severity level, such as:
info.log– General information messagesdebug.log– Debug-level messageserror.log– Application errorscritical.log– Critical failures and exceptions
You can view these logs manually or use the command line to inspect them quickly.
Navigate to Project Root
On Production Server (Linux)
cd /var/www/example.comOn Development Server
Linux / macOS (XAMPP)
cd /Applications/XAMPP/xamppfiles/htdocs/example.comWindows (XAMPP)
cd C:\xampp\htdocs\example.comWindows (WAMP)
cd C:\wamp64\www\example.comGeneric Windows (Custom Folder)
cd D:\projects\example.comReplace
example.comwith your actual project folder name. Use the path that matches your setup. If unsure, check where your local server hosts your project files.
View Logs from the Command Line
On Linux / macOS
To read a specific log file, you can use cat, tail, or less to view logs:
# View the entire file
cat writeable/logs/info.log

# View the last 20 lines
tail -n 20 writeable/logs/error.log

# Follow new log entries in real time
tail -f writeable/logs/debug.log

# Scrollable view
less writeable/logs/critical.log
On Windows (CMD or PowerShell)
Use type, Get-Content, or more:
:: View entire file
type writeable\logs\info.log

:: View last lines (PowerShell)
Get-Content writeable\logs\error.log -Tail 20

:: Follow logs in real-time (PowerShell)
Get-Content writeable\logs\debug.log -Wait

:: Scrollable view (CMD)
more writeable\logs\critical.log
Tip: For continuous monitoring in development or production, use
tail -f(Linux/macOS) orGet-Content -Wait(PowerShell).